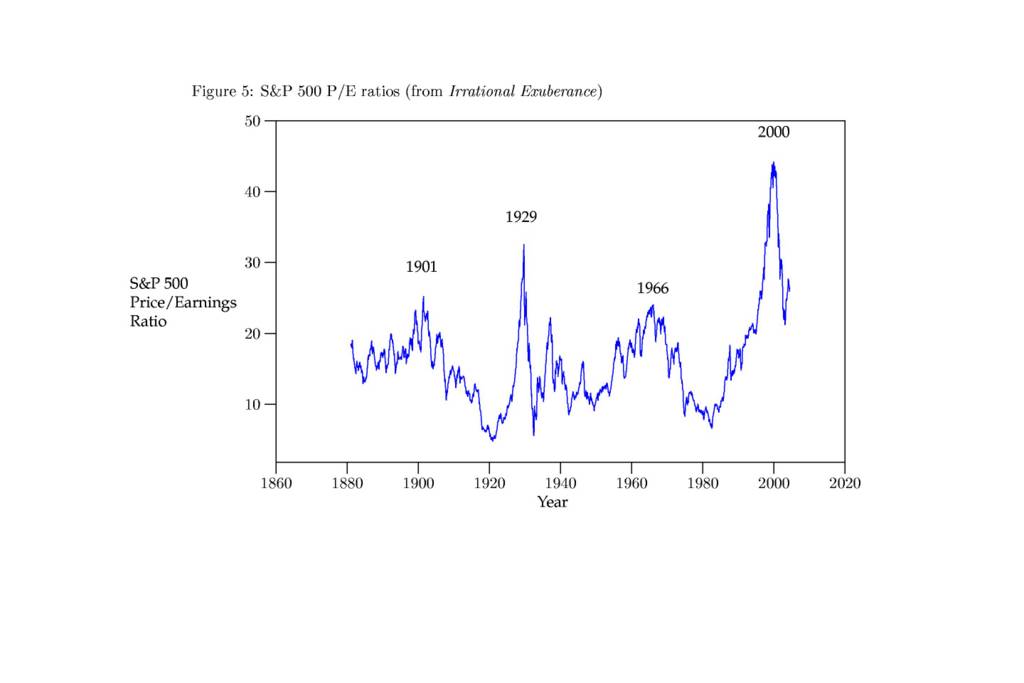
Another striking chart in Irrational Exuberance shows a history of P/E ratios for the S&P 500 with "bubble" years (1901, 1929, 1966 and 2000) marked at P/E peaks. Perhaps the most striking part of the graph is the most recent bubble which boasted a ratio near 45 compared to 25 in 1901, 32 in 1929, and 24 in 1966. Looking at the right side of the graph, it's easy to imagine a depression on the same scale as the 1930s! Once again, I think there are some misleading elements to the chart.
Previously I suggested that 15 might be a fair P/E ratio for the S&P 500, but that's obviously a simplification. For one thing, if when earnings are expected to grow in the future, it would be sensible to pay more for them now. That's why people bought companies like Amazon and Yahoo before they started turning a profit. Obviously some people overpaid for those growing earnings, but it's difficult to say exactly what P/E ratio is fair. (Yahoo entered the index in December of 1999, so it contributed to the record bubble valuation.)
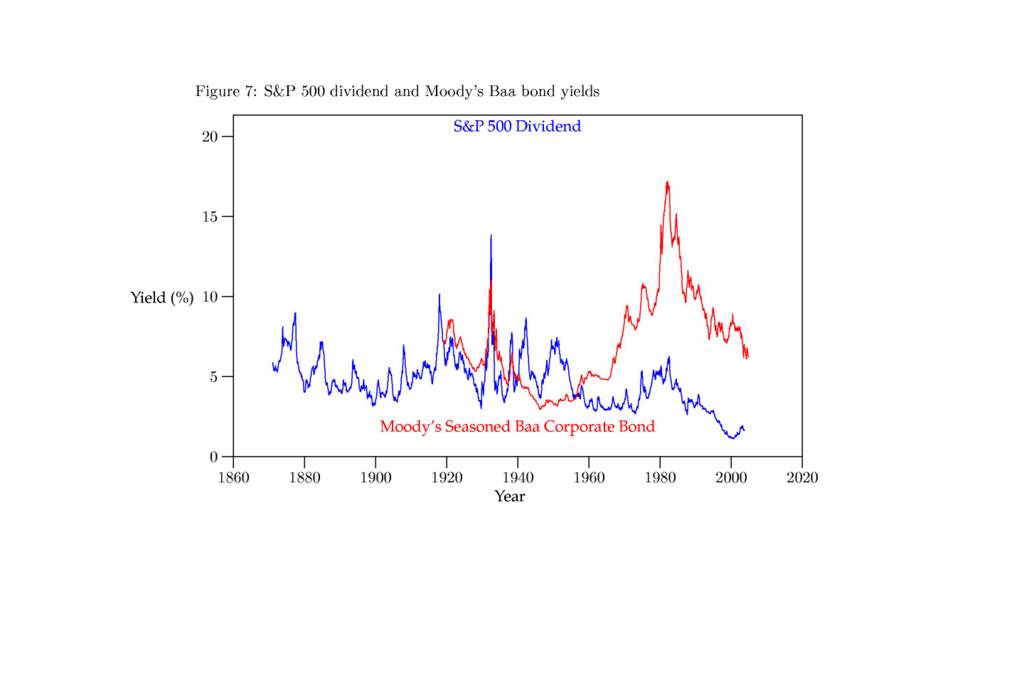
A difficulty with P/E ratios is that the don't mean much without context. One way to fix that is to convert them into earnings yields (earnings/price * 100%). It should be obvious that an earnings yield can be compared to bond yields, and therefore during periods of low interest rates earning yields should be low (and P/E ratios high). The logical bonds to compare to would be corporate bonds such as Moody's Baa. (Seasoned bonds are bonds sold on the open market.) If you look at the right-hand side the chart which shows that relationship, it looks highly correlated.
But what happened before 1960 or so? One obvious difference is that companies made a transition from paying dividends to retaining earnings. The left-hand side of the chart comparing dividend yields to bond yields correlates better than earnings yields. There are still unexplained divergences in the 1950s and I really should measure the correlation rather than eye-balling it, but I think the results are better than bare P/E ratios.
None of this, of course, changes the conclusion that the S&P 500 is currently richly priced. Earnings must grow dramatically to compensate for the risk of owning stock rather than holding bonds. Remember, bondholders get income now and priority in the event of bankruptcy proceedings.

No comments:
Post a Comment