Friday, November 19, 2004

Why I sold Oracle

On May 28, 2003 I sold Oracle at $13.35 a share. It was, oddly enough, the day my son, Joshua, was born. If you're imagining me on the phone with my broker while my wife struggled to give birth to my firstborn, stop that! For one thing, it isn't nice to imagine such a private moment, and for another I initiated the trade days before. Mainly I sold because I had to. That is, my brokerage charges a fee if I don't make at least one trade in 12 months. Also, Oracle was somewhat expensive in my opinion, though not so much that sold all of my shares.

Shortly after I sold, Oracle began it's hostile takeover bid for PeopleSoft. This was not a huge surprise for people who had listened to Larry Ellison, since he'd been suggesting that the enterprise software business had matured. Lots of analysts criticized the offer, since Oracle's price and revenue dropped off a bit. But as a long-term shareholder, I was pleased. PeopleSoft's operations could be minimized so that most of it's revenue ends up as profit for Oracle if the deal goes through.

As time goes on, I think Oracle (and other business software makers) will become more like cyclical stocks than growth stocks. As the economy picks up, companies will buy more licenses and when there is a recession, companies will cut spending on infrastructure. If that happens, I plan to look around for other places to invest.

Tuesday, November 16, 2004

Earnings yield

Another striking chart in Irrational Exuberance shows a history of P/E ratios for the S&P 500 with "bubble" years (1901, 1929, 1966 and 2000) marked at P/E peaks. Perhaps the most striking part of the graph is the most recent bubble which boasted a ratio near 45 compared to 25 in 1901, 32 in 1929, and 24 in 1966. Looking at the right side of the graph, it's easy to imagine a depression on the same scale as the 1930s! Once again, I think there are some misleading elements to the chart.

Previously I suggested that 15 might be a fair P/E ratio for the S&P 500, but that's obviously a simplification. For one thing, if when earnings are expected to grow in the future, it would be sensible to pay more for them now. That's why people bought companies like Amazon and Yahoo before they started turning a profit. Obviously some people overpaid for those growing earnings, but it's difficult to say exactly what P/E ratio is fair. (Yahoo entered the index in December of 1999, so it contributed to the record bubble valuation.)

A difficulty with P/E ratios is that the don't mean much without context. One way to fix that is to convert them into earnings yields (earnings/price * 100%). It should be obvious that an earnings yield can be compared to bond yields, and therefore during periods of low interest rates earning yields should be low (and P/E ratios high). The logical bonds to compare to would be corporate bonds such as Moody's Baa. (Seasoned bonds are bonds sold on the open market.) If you look at the right-hand side the chart which shows that relationship, it looks highly correlated.

But what happened before 1960 or so? One obvious difference is that companies made a transition from paying dividends to retaining earnings. The left-hand side of the chart comparing dividend yields to bond yields correlates better than earnings yields. There are still unexplained divergences in the 1950s and I really should measure the correlation rather than eye-balling it, but I think the results are better than bare P/E ratios.

None of this, of course, changes the conclusion that the S&P 500 is currently richly priced. Earnings must grow dramatically to compensate for the risk of owning stock rather than holding bonds. Remember, bondholders get income now and priority in the event of bankruptcy proceedings.

sp500_5.jpg


Posted by Hello

sp500_6.jpg


Posted by Hello

sp500_7.jpg


Posted by Hello

Tuesday, November 02, 2004

Value

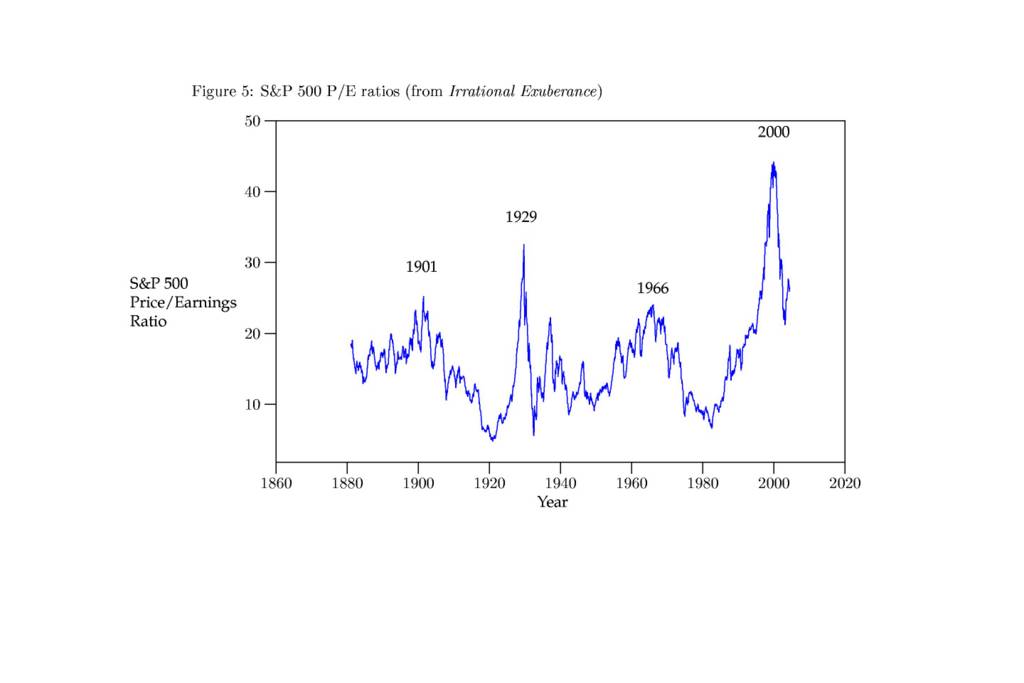
I recently finished Irrational Exuberance by Robert J. Shiller which suggested in 2000 that the U.S. stock market was overvalued. And of course, it was. Dr. Shiller suggests that people overvalue the market (defined by high price to 10 year average earnings ratios), when they think the old rules no longer apply. For instance, in 1929 people thought new technology, easy credit and popular interest in investing meant that high P/E ratios were sustainable.

It doesn't take much in the way of mental gymnastics to imagine each of these things being said in 1999. The Internet, Globalization, and Mutual Funds seemed poised to sustain higher earnings growth than anyone could have imagined 5 or 10 years earlier. (The book discusses lots of factors that contributed to bubble valuations, but these are the ones I remember having an impact on me -- right at the start of my investment experience.)

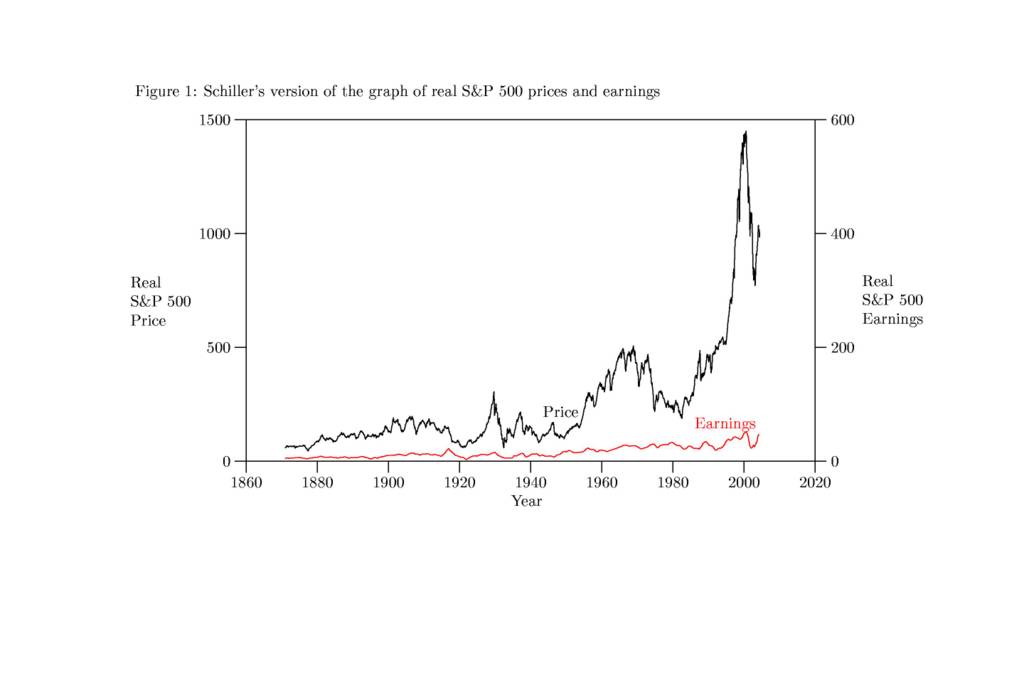
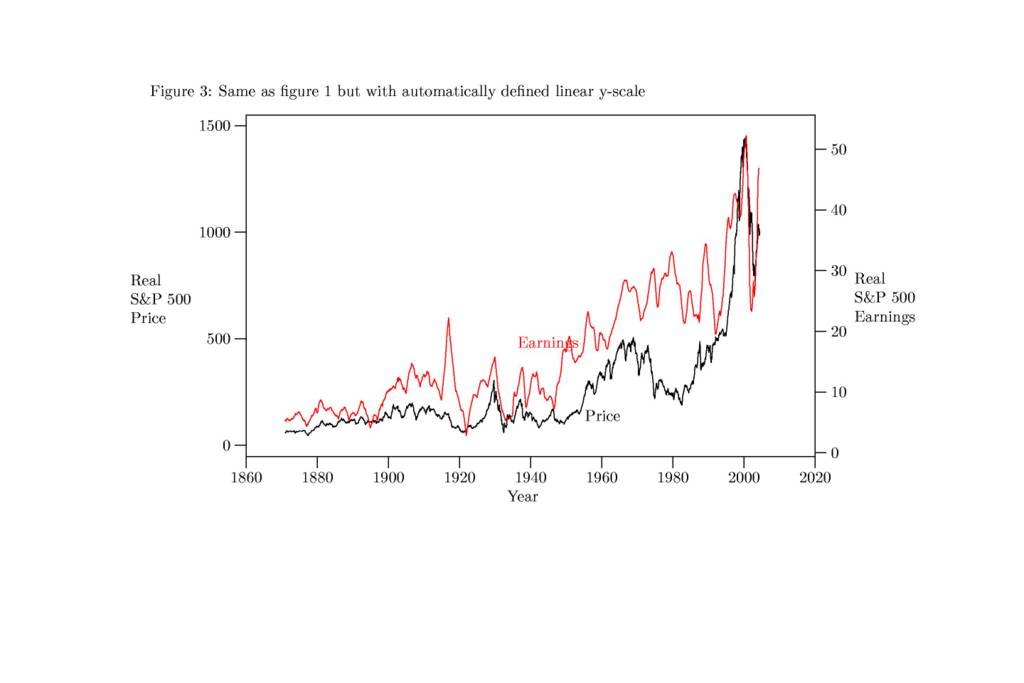
One of the most striking parts of the book, is a graph showing the rise of stock prices and earnings (as represented by the S&P 500 index) over the last 130 years or so. I've reproduced the figure below. It shows earnings increasing at a moderate rate and prices jumping all over the place. Especially interesting are the booms in the 1920s and 1960s followed by busts in the 1930s and 1970s. From 1982 to 2000 the divergence begins to look especially ludicrous. It sure looks like prices are headed south, despite the recent drop.

But there are a couple of problems with this graph. The tipoff is the scales on the left and the right. The left (price) goes to $1500[1] and the right (earnings) goes to $600, but there is no indication how those scales were chosen. Obviously if both lines were on the same scale, earnings would look nearly flat (since earnings are anywhere from 5 to 45 times smaller than prices). But if we are going to look at different scales, why not pick a scale that matches the range of earnings, say $0 to $55? One problem, from the point of view of selling the book's premise, is that prices wouldn't look so dramatically high.

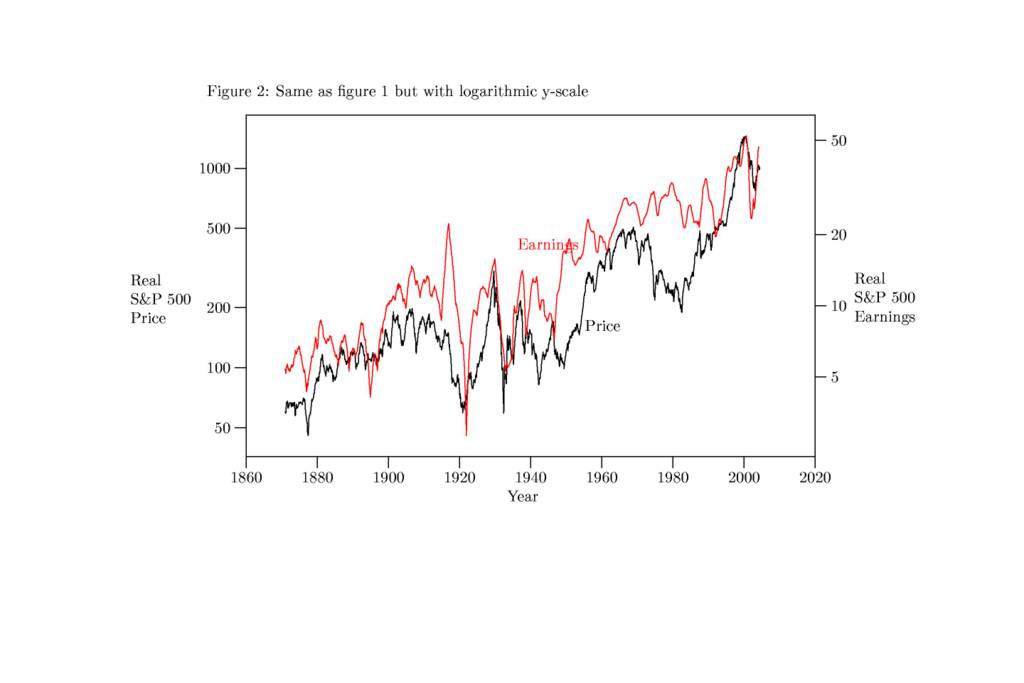
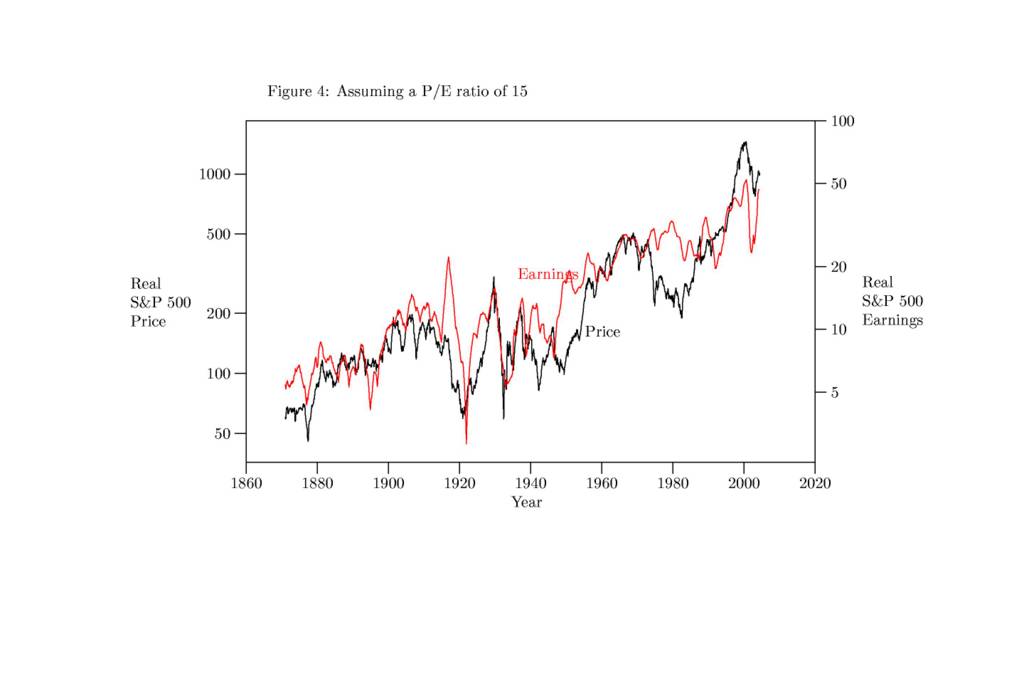
Another issue is that the scale is linear. Even adjusted for inflation, S&P 500 prices and earnings are several orders of magnitude greater now than they were in 1871. On a linear scale, a large move percentage-wise is more dramatic when prices are high and muted when prices are low. If you have a $1000 invested that looses 10%, you're down $100 whether the price per share is $10 or $100. But if you put both changes on the same linear scale, the drop from $100 to $90 is more dramatic than the drop from $10 to $9. One way to correct for this illusion is to use a logarithmic scale. I've used the same data to created a corrected version of the chart.

I'm not saying that Dr. Shiller is wrong or trying to mislead, but this chart is misleading. Earnings and prices don't fit on the same scale, but putting them on the same graph suggests a relationship between them. Implicit in the original graph is the suggestion that P/E ratios should be around 2.5 (since 1500/600 is 2.5). Using a linear graph and letting the graphing software determine the range suggests a P/E ratio of about 27. (Linear graphs are better for accurately determining absolute values.) That's skewed by very high ratios in the last few years.

And this is the frusterating aspect Irrational Exuberance -- it makes a strong case that the market was overpriced in 2000, but it doesn't spend much time discussing the fair value of the market. The historical average is about 16 which is again skewed by recent history. I've produced another chart assuming a fair P/E ratio of 15. Years in which the Earnings line ducks under the Price line (such as 2000) would be years when the market is overvalued. Maybe this ratio is fair and maybe it isn't.

A practical question for me, right now, is whether or not the S&P 500 index is overpriced at a P/E of 18. I think it might be.

Footnote:
[1]   I noticed after I made the graph that the original goes to $1600.

sp500_1.jpg


Posted by Hello

sp500_2.jpg


Posted by Hello

sp500_3.jpg


Posted by Hello

sp500_4.jpg


Posted by Hello