Monday, January 31, 2005

Defensive Win Shares redux

Back in August, I suggested that the Lo Duca's defense might be overstated by defensive Win Shares. One test would be to see if his defense remained stable from the Dodgers to the Marlins. As it happens, he had 5.3 defensive Win Shares in LA and 1.8 in Florida. That's over 779 2/3 innings verus 413, which works out to 0.00680 WS/inn. vs. 0.00436. So it would appear that Lo Duca benefited from the Dodgers good defense.

Unfortunately, this is a really small sample. It's easy to imagine a catcher slowing down over the season and becoming less effective, which is just the reputation Lo Duca has. A better study would include lots of trades with catchers moving from bad defensive teams to good and vice versa. This still might not be enough.

The other way to look at the effect of the trade would be to compare team defense before and afterwards. The data isn't really available, however. (At least not without doing a lot of work.)

Thursday, January 27, 2005

Open source risk for Oracle?

One of the things I worried about when I bought Oracle was "What happens when someone makes an open source version of their products?" I mean, why would anyone pay $149 a user for Oracle Database Standard Edition One, when they could get PostgreSQL free? Assuming they have the same functionality (which they don't), the answer is the cost of changing database software. Joel Spolsky has an excellent article explaining why companies might support open source software even to the point of paying developers to work on it. You should go read that article if you promise to come right back.

More informed? Good. Ok, Oracle is happy to have, for instance, open source file systems that are optimized for running their database. And it probably doesn't bother them too much to have open source "Application Servers", like JBoss, even though they offer a competing product. That's because they want complements to be cheap so they can charge more for their core product: the database. So why aren't they more worried about open source databases such as MySQL and PostgreSQL?

It's clear that Oracle has lowered their price on the very basic versions of the database in response to not just open-source products, but Microsoft and other low-cost providers. At the high-end, there has been price pressure on Enterprise Edition as well, but that doesn't have much to do with open source. Obviously Oracle would love to charge more for low-end products, but they aren't making the big money on small customers. Selling to small customers is a bonus (especially if they eventually become big).

From a strictly technical point of view, PostgreSQL is the only real open source competitor to Oracle. Unlike MySQL (and most commercial database systems), Oracle uses multiple versions of the data stored in the database, which means different applications can change and access the database at the same time without bring it to a standstill. On top of this base, Oracle has designed a system to spread the database across a cluster of computers. PostgreSQL doesn't yet have this ability, but it is only a matter of time before someone will make it happen.

In the meantime, Oracle is trying to diversify away from reliance on the database product, which is the purpose of buying PeopleSoft/JD Edwards. If you read SEC filings of many different companies, you've probably noticed charges labeled "SAP" that occur over the course of several quarters. Huge software/process upgrades like this are the market that Oracle is trying to tap into, and open source software is a compliment for these systems. This is doubly so if Oracle manages to build up it's outsourcing business.

As was brought out in the anti-trust trial, most of the applications companies buy are not all that difficult to duplicate. Basic accounting and human resources functions can be found in any number of products. More difficult (especially if not built on Oracle's database), is moving all of a company's information into one place. Vastly more difficult than that is creating a structure to hold all the data of any particular organization.

Friday, January 14, 2005

Your 2005 LA Dodgers

I recently finished Win Shares, so I got curious how the new Dodgers compare to the old Dodgers. First, the additions:

Player         Team   POS    Bat  Pitch Field  ExpWS    WSP   WSAA Total
J Drew         ATL    OF    29.4    0.0   4.8     17   .986     17    34
J Kent         HOU    2B    15.9    0.0   7.4     16   .711      7    23
J Valentin     CHW    SS     8.4    0.0   6.1     13   .551      1    14
R Ledee        PHI    OF     4.7    0.0   1.1      3   .819      2     6
D Lowe         BOS    P      0.2    5.4   0.0     10   .272     -5     6
P Bako         CHC    C     -0.2    0.0   1.6      4   .166     -3     1

That works out to be roughly 28 wins. Now, here's what they lost:

A Beltre       LAD    3B    31.2    0.0   6.1     18  1.031     19    37
A Cora         LAD    2B    11.9    0.0   5.1     14   .622      3    17
S Green        LAD    1B    13.7    0.0   2.4     18   .438     -2    16
J Hernandez    LAD    2B     7.5    0.0   2.3      7   .741      3    10
S Finley       LAD    OF     7.1    0.0   2.0      7   .673      2     9
S Finley       ARI    OF     6.7    0.0   2.9     12   .399     -2     9
J Lima         LAD    P     -1.1   10.6   0.0      8   .583      1     9
R Ventura      LAD    1B     5.3    0.2   0.7      5   .681      2     6
B Mayne        ARI    C      0.4    0.0   1.0      3   .242     -2     1
B Mayne        LAD    C     -1.4    0.0   1.4      3   .000     -3     0
H Nomo         LAD    P     -1.1   -5.4   0.0      4  -.808    -10    -6

That's 38 wins (or 36 if you give the Dodgers credit for losing Nomo). I included Finley and Mayne's stats with the Diamondbacks because if they had stayed Dodgers and contributed the same in 2005 as they did in 2004, the Dodgers would be beneficiaries of the entire season's statistics.

WSAA is a Hardball Times stat (Win Shares Above Average) that tries to correct for players who get a lot of playing time and some Win Shares, but hurt their team overall. The new additions increase wins above average by about 6 and the guys who are leaving add about 4. The discrepancy is largely due to guys like Shawn Green, who added 16 win shares but was expected to contribute 18. In other words, this off-season has been largely about replacing players who contribute less then they should for players who contribute more. The two biggest exceptions are Beltre and Lowe.

To quantify that a bit more, the new players were expected to get 63 win shares and actually got 84. The old players were expected to get 99 win shares and got 108. That works out to 0.667 Win Share rate versus 0.545. Assuming players do about the same they did last year, the new Dodgers should be a better than the old.

Here are the players who haven't moved (as far as I can tell):

C Izturis      LAD    SS    18.2    0.0   7.1     20   .642      6    25
M Bradley      LAD    OF    13.1    0.0   4.4     16   .537      1    17
E Gagne        LAD    P     -0.1   16.1   0.0      8   .979      8    16
J Werth        LAD    OF    10.5    0.0   1.6      9   .683      3    12
O Perez        LAD    P     -2.3   14.6   0.0      9   .659      3    12
J Weaver       LAD    P     -0.8   12.6   0.0     10   .573      2    12
G Carrara      LAD    P     -0.1    6.7   0.0      3  1.025      3     7
D Sanchez      LAD    P      0.2    5.7   0.0      4   .671      1     6
W Alvarez      LAD    P     -1.3    7.2   0.0      6   .491      0     6
K Ishii        LAD    P     -1.3    7.1   0.0      8   .356     -2     6
Y Brazoban     LAD    P      0.0    4.5   0.0      2  1.187      3     4
O Saenz        LAD    1B     3.8    0.0   0.3      3   .660      1     4
J Grabowski    LAD    OF     3.3    0.0   0.5      5   .398     -1     4
E Dessens      LAD    P     -0.1    1.7   0.0      1   .775      1     2
D Dreifort     LAD    P      0.0    2.2   0.0      3   .321     -1     2
M Kida         LAD    P      0.0    0.7   0.0      0  1.482      0     1
B Penny        FLO    P     -2.4   10.6   0.0      6   .662      2     8
B Penny        LAD    P     -0.1    0.8   0.0      1   .639      0     1
D Ross         LAD    C     -0.5    0.0   1.6      5   .103     -4     1
R Myers        LAD    P      0.0    0.3   0.0      0  1.482      0     0
J Flores       LAD    3B    -0.1    0.0   0.0      0  -.276      0     0
M Venafro      LAD    P      0.0    0.3   0.0      1   .295      0     0
A Perez        LAD    2B     0.1    0.0   0.1      0   .161      0     0
T Wilson       LAD    C     -0.2    0.0   0.1      0  -.356      0     0
S Stewart      LAD    P      0.0    0.3   0.0      1   .191      0     0
J Thurston     LAD    2B    -0.1    0.0   0.0      0  -.062      0     0
C Chen         LAD    OF    -0.6    0.0   0.2      0  -.879     -1     0
B Falkenborg   LAD    P     -0.1   -0.7   0.0      1  -.481     -1     0
E Jackson      LAD    P      0.2   -0.6   0.0      1  -.143     -2     0
H Choi         LAD    1B     0.1    0.0   0.3      2   .090     -2     0

The still-Dodgers had 146 Win Shares and were expected to get 125. When you add in the new players 84, you could estimate that the Dodgers will get about 77 wins. Ultimately, the Dodgers need to distribute more playing time to more efficient players in order to improve in 2005.

And for completeness, here are the guys traded during the 2004 season:

P Lo Duca      LAD    C     10.1    0.0   5.3     10   .735      5    15
P Lo Duca      FLO    C      4.6    0.0   1.8      6   .557      1     6
D Roberts      LAD    OF     9.1    0.0   1.4      7   .722      3    11
D Roberts      BOS    OF     1.4    0.0   1.0      3   .452      0     2
G Mota         LAD    P     -0.5    8.6   0.0      4  1.057      4     8
G Mota         FLO    P      0.6    2.3   0.0      3   .546      0     3
J Encarnacio   LAD    OF     6.1    0.0   1.6     10   .394     -2     8
J Encarnacio   FLO    OF     4.1    0.0   1.2      5   .522      0     5
T Martin       LAD    P      0.0    1.2   0.0      2   .352     -1     1
T Martin       ATL    P      0.0    1.2   0.0      1   .460      0     1

Wednesday, December 15, 2004

Why I bought Canon (again)

I very nearly caught up on all the investment decisions I've made thus far, and I managed to not mention limit orders. All of my stock purchase and sales have been executed as limit orders, which means that I pick a price and my broker tries to get it for me. In contrast market orders are executed at whatever price the broker can find on the open market. Since I have a pretty good idea what I want to pay (or receive) for a stock, and since I live on the West Coast and don't get up early for the opening bell, limit orders work well for me. A further twist to limit orders is the Good-Until-Canceled order which let's me leave the order open for 30 day, until I cancel it, or the order is executed at my price. That way I can set a price, forget about my account for a month, and not miss opportunities.

The danger, of course, is missing out on a great stock because it never quite falls low enough or selling too late if the price never quite reaches my "reserve". In fact, I had money to spend almost all year, tried to buy Select Comfort, Pixar and Canon at various times, but couldn't because my limit orders never got executed. Finally, I ran against the deadline of making at least one trade a year, yet again. Canon seems way undervalued according to the intrinsic value calculations I've done. I guess it trades at something like a 30 to 50% discount. Considering Canon's impressive growth and ~1% dividend, I jumped at the chance to buy at $50.

Actually I started at $49, but when that price wasn't reached after a week or so, I tried $50. On November 30, Canon's day low was $50.01 so my order was not executed. I was tempted to try a market order the next day, but I resisted. Since Canon trades primarily on the Tokyo Stock Exchange, it's relatively easy to guess the next day's price in New York -- just convert the closing price in Tokyo from yen to dollars. On December 1, I found out that my broker had executed my order at $49.66, which was that day's low. Since the market price was less than my limit price, my patience paid off in a small way.

Monday, December 13, 2004

Glad I didn't short PeopleSoft!

I suggested back in September that shorting PeopleSoft would be a pretty good risk. I was horribly wrong. Anyone who tried it would have lost about $7.15 a share. That would be an annualized loss of about 7% (depending on commissions). In short, it was a terrible investment idea.

According to Larry Ellison some of PeopleSoft's ongoing revenue was better than Oracle had estimated. I sure hope so, because it's difficult to see how this deal makes sense otherwise. I've had 18 months to ponder this and it seems to me that the only way this deal works in Oracle's favor is if they can retain PeopleSoft's revenue and cut the fat. Using Quicken's intrinsic value calculator:

Revenue (TTM)            = $2.67 (billion)
Assumed operating margin = 20%
Assumed operating income = $0.534(billion)
Assumed growth rate      = 5%
Discount rate            = 11%
Intrinsic value          = ~$25
It appears Oracle is overpaying about $1.50 a share.

I've had to make a ton of assumptions, which presumably Oracle management didn't have to do. For instance, maybe there are more costs that can be cut or perhaps there are deals in PeopleSoft's pipeline that we don't know about. But the possibility exists that Oracle was over-eager to get the deal done. It's troubling that the final price is just 50¢ more than the previous high bid, because it seems like a face-saving device for the PeopleSoft board, rather than a robustly calculated number. Also, Ellison pointed out that he didn't really see anything that surprised him in the PeopleSoft numbers, just that he didn't have to be so conservative in his estimates. We have a strong tendency to see the things we want to see.

Thursday, December 09, 2004

Surname Distribution in the U.S.

It is now possible to see the influence of Ericsons spread from 1920 to 1990. It's also easy to figure out why so many people think there's a "k" in my name.

Monday, December 06, 2004

Why I buy the Excelsior Value & Restructuring fund

Starting next year, I won't be forced into buying Raytheon stock every two weeks. And since I'm way over-exposed to Raytheon and I don't think it's a particularly good buy, I won't. That means I need to find other things to invest. Also, I still want to diversify away from the S&P 500. My screen didn't show enough funds, so I started playing around with relaxed criteria. As it turns out, when I eliminated the manager tenure requirement I found this fund:

 					Non-Load Adjusted Returns
Investment Name                         1 Yr	3 Yr	5 Yr	10 Yr	LOF
---------------                         ------  ------  ------  ------  ------
Excelsior Value & Restructuring		19.56%	11.48%	8.83%	15.89%	17.22%

Fidelity doesn't know that David J. Williams, the fund's manager, has been either manager or co-manager since the fund started in 1992. I decided that this is good enough to meet my requirements even if Fidelity doesn't agree.

When looking at companies, there is normally too much information. I don't think I could ever bring myself to buy McDonald's no matter how great an investment it might be, because I don't like their product. The opposite is true of Oracle -- I'll probably hang on too long because I like their database. It's irrational and puts me at a disadvantage.

Mutual funds have nearly the opposite problem. The only thing it produces are investment returns and all you know about how a fund gets them is reading some generic phrases in the prospectus. Just about everything can (and often is) manipulated by the fund management. For instance, the top holdings are sometimes changed at the last minute to give the appearance that the manager picked hot stocks (like Taser this year). (There's even a term for this: "window dressing".)

One of the things I like about the Value & Restructuring fund is the handful of presentations and essays found on it's website. Value investing is interesting to me since I buy individual stocks. The "restructuring" aspect of the fund should also be fun to watch. For instance, the fund bought Black & Decker during a restructuring in 2002. The tool maker needed to reduce costs by shifting production to places like Mexico and the Czech Republic. It also needed to control inventories -- especially of seasonal products. In Peter Lynch's parlance, it's been a two-bagger since then.

The fund commentary also talks about disappointments, such as AOL Time Warner. I don't know if the fund will do better than it's benchmarks over the next few years, but I appreciate the honesty. It feels less like throwing darts and more like investing.

Friday, December 03, 2004

"That ship has sailed"

A while ago I used the phrase "that ship has sailed" in anger, but I wasn't sure why. I mean, I hadn't thought to use it before and I wasn't even sure I had used it correctly. It was like slipping into a foreign language in the middle of a conversation.

Since then, I've noticed lots of other people who use the phrase -- sitcom actors, columnists, bloggers, and so on. I can't decide whether I started noticing because of my (embarrassingly inept) use of the phrase or if I'm part of broad attempt at popularizing it. One way to gather information about this might be to use Google's newsgroup archive. The phrase was first used in 1990 (at least in groups archived by Google). Roughly 3/4 of the references are after 2000. In the last year it's been used about 200 out of 829 times. Of course the volume of posts have increased as well.

One way to work around the problem would be to find a "control phrase" which has not changed frequency over the same period. Maybe, "sounds good to me" or "I don't think so". Even better, use a group of phrases. Then compare the change in frequency to the control. Best would be if Google published volume statistics by year.

Thursday, December 02, 2004

Why I buy the T. Rowe Price Small Cap Stock fund

Most of my retirement savings are tied up in my 401(k) plan, which from the beginning I've invested in a S&P 500 Index fund and Raytheon stock. I don't (currently) have much choice is the Raytheon investment, but my plan offers many options besides the index fund. I didn't spend much time looking at other options, mostly because I didn't know how to evaluate them. Who cares if a fund beat the market last year -- I want to know if it will beat the market for the next 30 years.

Last spring, the Motley Fool hired Shannon Zimmerman from Morningstar to cover Mutual funds. I've read the Fool as far back as when my family used AOL in the early 90s, and this was the first time I'd considered the idea that actively-managed mutual funds could consistently out-perform the market as a whole. Based on his first few months of articles, I came up with a screen to find the best candidates my 401(k) plan offered.

Stock Investments

At some point I should diversify to bonds for a percentage of my portfolio, but I'm young, interest rates are still going up, and stocks should continue to outperform bonds over the long-haul. I may need to re-evaluate this criteria in time.

Expense Ratio <= 1.00%

I wish I could get a fund that charged less than 0.5%, but actively managed funds don't usually come that cheap. Expenses for investors are like friction to bicyclists -- a drag. You can bet that Lance Armstrong has the smoothest ride possible because a poorly lubricated part could shave seconds off his time. We could trade bikes and he would still beat me, but he'd probably be dead last if he used my bike in the Tour de France. So the lower fee, the better, when it comes to mutual funds.

Equity Turnover Ratio <= 50%

Besides being another form of drag (trading expenses are reflected in the NAV, not the expense ratio), excessive trading is a sign of a manager who is chasing performance rather than evaluating companies from the bottom up. I'm looking for a manager who knows how to pick stocks that will beat the market over the long-term, not managers who get lucky trading over the short-term. 50% churn translates to an average holding period of 2 years.

Manager Tenure >= 10 years

I'm going to compare 10 year annualized returns, so it makes sense that I compare funds that have been under the same management for that period. The actual experience of a particular manager might be a lot more than his tenure on a particular fund, so if I were interested in a particular manager I wouldn't care too much if he were with a fund for only a short time. But so far I don't know any managers who fit that description.

Here is the result of that screen (as of today):

 					Non-Load Adjusted Returns
Investment Name                         1 Yr	3 Yr	5 Yr	10 Yr	LOF
---------------                         ------  ------  ------  ------  ------
Fidelity Equity-Income Fund		11.98%	6.52%	2.69%	10.72%	13.03%
T. Rowe Price Small Cap Stock SHS	15.17%	11.76%	11.80%	13.13%	13.57%
Vanguard PRIMECAP Fund Admiral Class	14.53%	--	--	--	7.39%

S&P 500 INDEX FUND			13.77% 	4.16% 	-1.15% 	11.12% 	13.07%
Vanguard PRIMECAP Fund 			17.86%	7.07%	3.38%	15.48%	--

Historical returns

I had to add the S&P 500 Index fund, since the screen didn't know the expense ratio (something less than 0.1%), turnover (about 2%) or management tenure (effectively forever). I also added the Vanguard PRIMECAP fund information from Morningstar, since the "Admiral Class" doesn't have a very long history. (I think the difference is in fee structure or something.) The Life Of Fund (LOF) number is fairly meaningless since a fund started in 1982 will look better than one started in 1999.

The T. Rowe Price fund seemed the best investment last spring because it beat the market in good times and bad, and I didn't have any exposure to small companies. In general, carefully picked small companies should do better than larger companies because there is more room to grow. People didn't become millionaires by investing in Microsoft in 1999, but in 1989 when it was relatively small and unknown.

Friday, November 19, 2004

Why I sold Oracle

On May 28, 2003 I sold Oracle at $13.35 a share. It was, oddly enough, the day my son, Joshua, was born. If you're imagining me on the phone with my broker while my wife struggled to give birth to my firstborn, stop that! For one thing, it isn't nice to imagine such a private moment, and for another I initiated the trade days before. Mainly I sold because I had to. That is, my brokerage charges a fee if I don't make at least one trade in 12 months. Also, Oracle was somewhat expensive in my opinion, though not so much that sold all of my shares.

Shortly after I sold, Oracle began it's hostile takeover bid for PeopleSoft. This was not a huge surprise for people who had listened to Larry Ellison, since he'd been suggesting that the enterprise software business had matured. Lots of analysts criticized the offer, since Oracle's price and revenue dropped off a bit. But as a long-term shareholder, I was pleased. PeopleSoft's operations could be minimized so that most of it's revenue ends up as profit for Oracle if the deal goes through.

As time goes on, I think Oracle (and other business software makers) will become more like cyclical stocks than growth stocks. As the economy picks up, companies will buy more licenses and when there is a recession, companies will cut spending on infrastructure. If that happens, I plan to look around for other places to invest.

Tuesday, November 16, 2004

Earnings yield

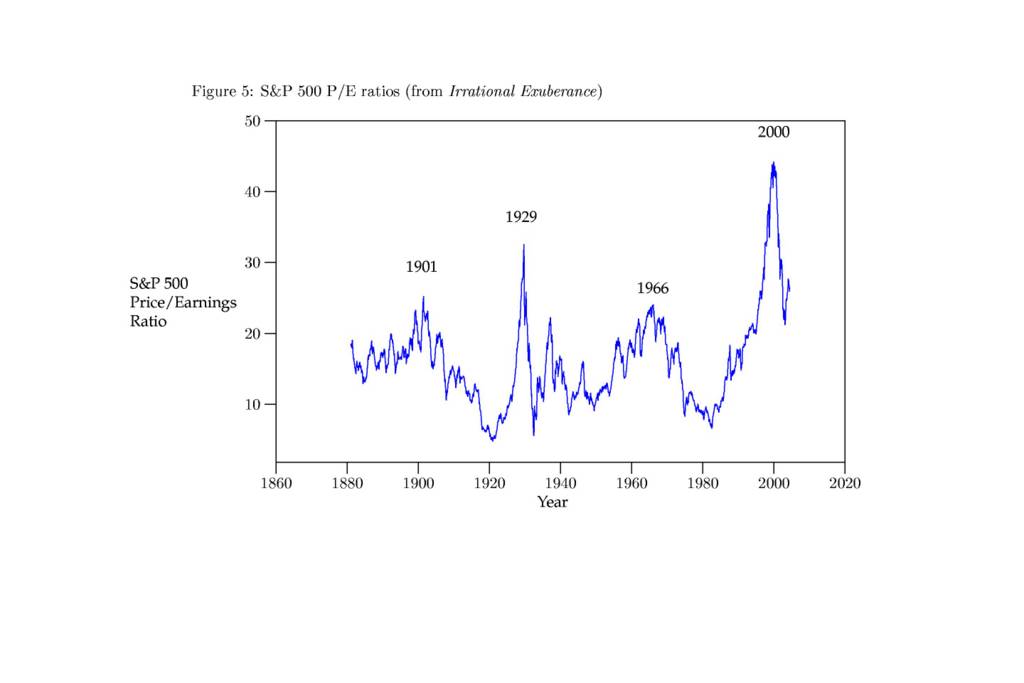
Another striking chart in Irrational Exuberance shows a history of P/E ratios for the S&P 500 with "bubble" years (1901, 1929, 1966 and 2000) marked at P/E peaks. Perhaps the most striking part of the graph is the most recent bubble which boasted a ratio near 45 compared to 25 in 1901, 32 in 1929, and 24 in 1966. Looking at the right side of the graph, it's easy to imagine a depression on the same scale as the 1930s! Once again, I think there are some misleading elements to the chart.

Previously I suggested that 15 might be a fair P/E ratio for the S&P 500, but that's obviously a simplification. For one thing, if when earnings are expected to grow in the future, it would be sensible to pay more for them now. That's why people bought companies like Amazon and Yahoo before they started turning a profit. Obviously some people overpaid for those growing earnings, but it's difficult to say exactly what P/E ratio is fair. (Yahoo entered the index in December of 1999, so it contributed to the record bubble valuation.)

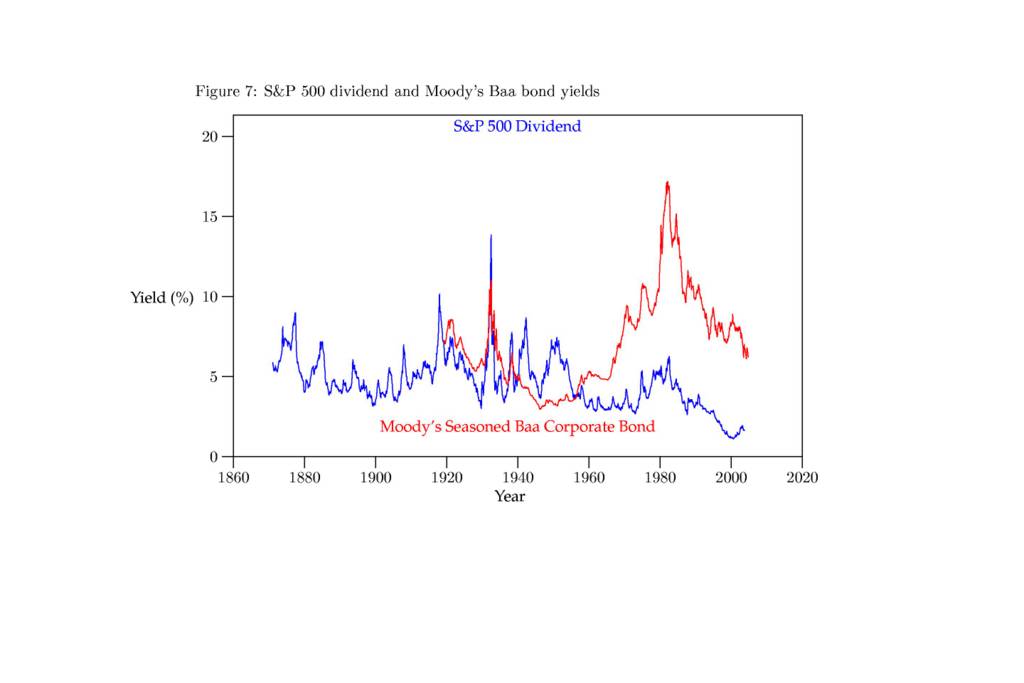
A difficulty with P/E ratios is that the don't mean much without context. One way to fix that is to convert them into earnings yields (earnings/price * 100%). It should be obvious that an earnings yield can be compared to bond yields, and therefore during periods of low interest rates earning yields should be low (and P/E ratios high). The logical bonds to compare to would be corporate bonds such as Moody's Baa. (Seasoned bonds are bonds sold on the open market.) If you look at the right-hand side the chart which shows that relationship, it looks highly correlated.

But what happened before 1960 or so? One obvious difference is that companies made a transition from paying dividends to retaining earnings. The left-hand side of the chart comparing dividend yields to bond yields correlates better than earnings yields. There are still unexplained divergences in the 1950s and I really should measure the correlation rather than eye-balling it, but I think the results are better than bare P/E ratios.

None of this, of course, changes the conclusion that the S&P 500 is currently richly priced. Earnings must grow dramatically to compensate for the risk of owning stock rather than holding bonds. Remember, bondholders get income now and priority in the event of bankruptcy proceedings.

sp500_5.jpg


Posted by Hello

sp500_6.jpg


Posted by Hello

sp500_7.jpg


Posted by Hello

Tuesday, November 02, 2004

Value

I recently finished Irrational Exuberance by Robert J. Shiller which suggested in 2000 that the U.S. stock market was overvalued. And of course, it was. Dr. Shiller suggests that people overvalue the market (defined by high price to 10 year average earnings ratios), when they think the old rules no longer apply. For instance, in 1929 people thought new technology, easy credit and popular interest in investing meant that high P/E ratios were sustainable.

It doesn't take much in the way of mental gymnastics to imagine each of these things being said in 1999. The Internet, Globalization, and Mutual Funds seemed poised to sustain higher earnings growth than anyone could have imagined 5 or 10 years earlier. (The book discusses lots of factors that contributed to bubble valuations, but these are the ones I remember having an impact on me -- right at the start of my investment experience.)

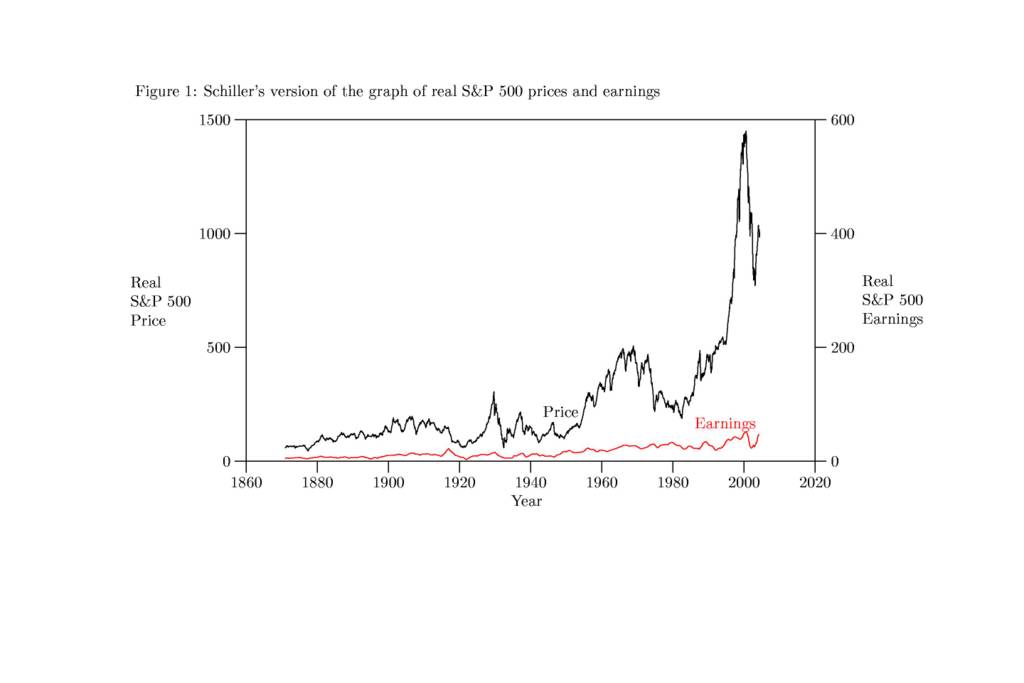
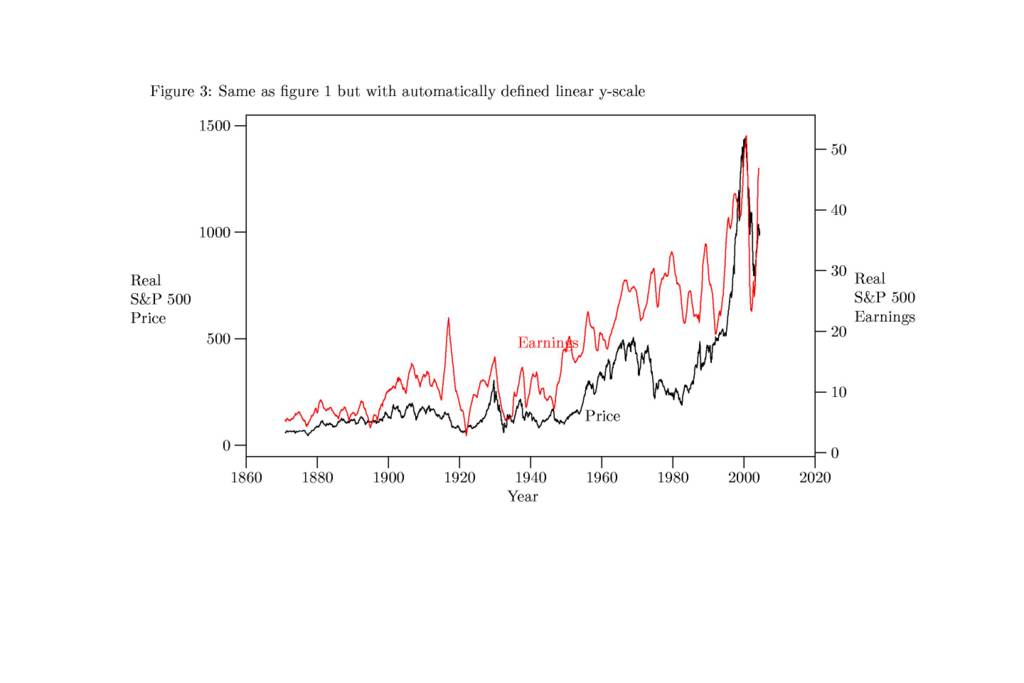
One of the most striking parts of the book, is a graph showing the rise of stock prices and earnings (as represented by the S&P 500 index) over the last 130 years or so. I've reproduced the figure below. It shows earnings increasing at a moderate rate and prices jumping all over the place. Especially interesting are the booms in the 1920s and 1960s followed by busts in the 1930s and 1970s. From 1982 to 2000 the divergence begins to look especially ludicrous. It sure looks like prices are headed south, despite the recent drop.

But there are a couple of problems with this graph. The tipoff is the scales on the left and the right. The left (price) goes to $1500[1] and the right (earnings) goes to $600, but there is no indication how those scales were chosen. Obviously if both lines were on the same scale, earnings would look nearly flat (since earnings are anywhere from 5 to 45 times smaller than prices). But if we are going to look at different scales, why not pick a scale that matches the range of earnings, say $0 to $55? One problem, from the point of view of selling the book's premise, is that prices wouldn't look so dramatically high.

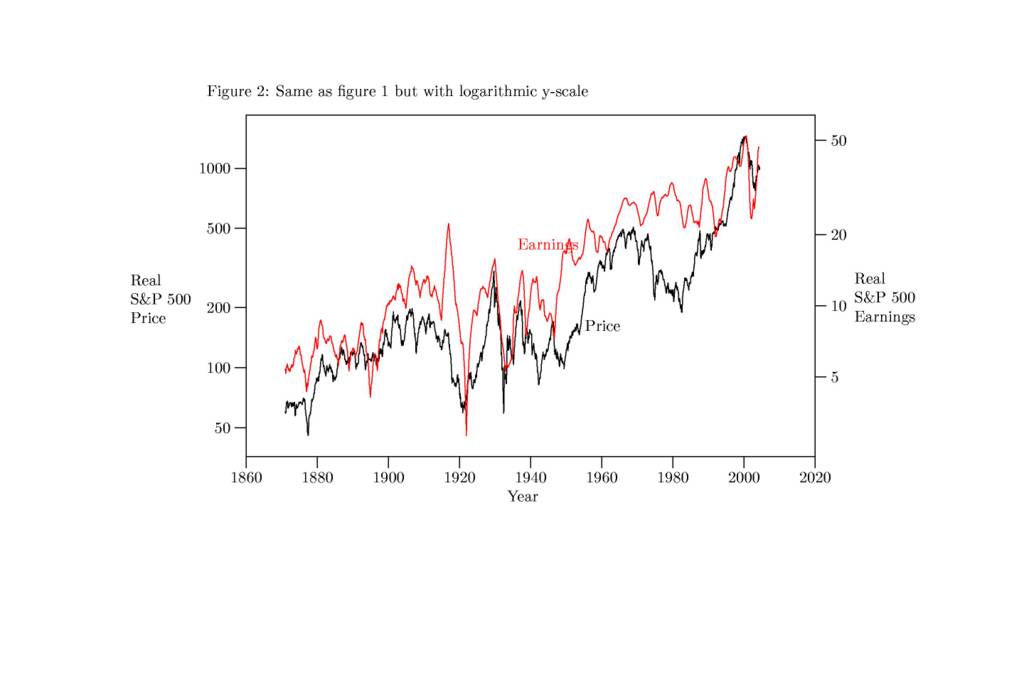
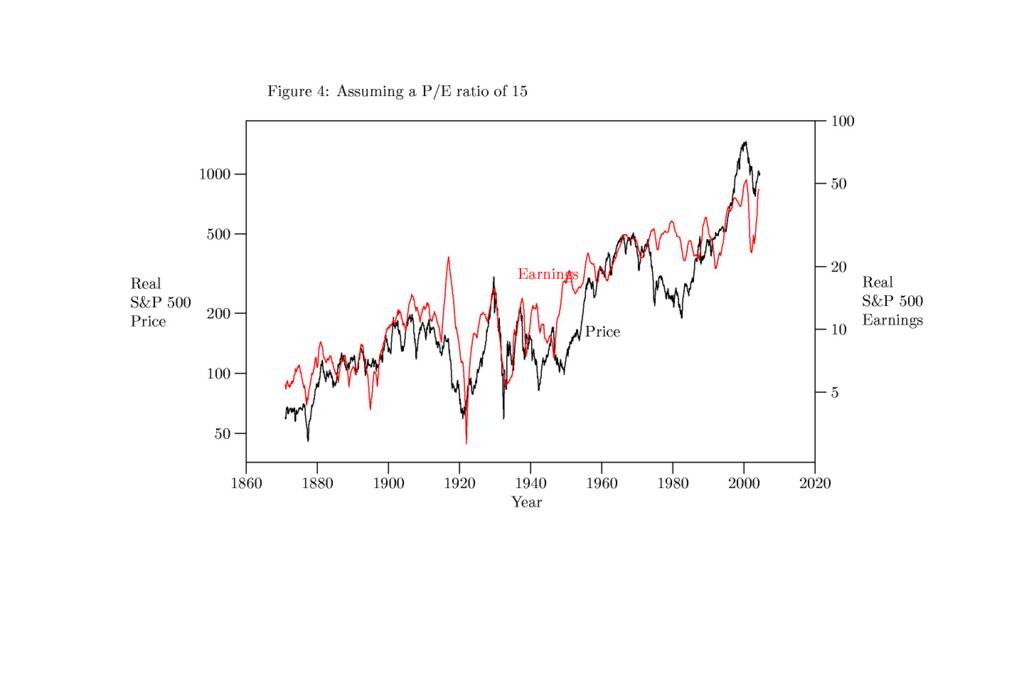
Another issue is that the scale is linear. Even adjusted for inflation, S&P 500 prices and earnings are several orders of magnitude greater now than they were in 1871. On a linear scale, a large move percentage-wise is more dramatic when prices are high and muted when prices are low. If you have a $1000 invested that looses 10%, you're down $100 whether the price per share is $10 or $100. But if you put both changes on the same linear scale, the drop from $100 to $90 is more dramatic than the drop from $10 to $9. One way to correct for this illusion is to use a logarithmic scale. I've used the same data to created a corrected version of the chart.

I'm not saying that Dr. Shiller is wrong or trying to mislead, but this chart is misleading. Earnings and prices don't fit on the same scale, but putting them on the same graph suggests a relationship between them. Implicit in the original graph is the suggestion that P/E ratios should be around 2.5 (since 1500/600 is 2.5). Using a linear graph and letting the graphing software determine the range suggests a P/E ratio of about 27. (Linear graphs are better for accurately determining absolute values.) That's skewed by very high ratios in the last few years.

And this is the frusterating aspect Irrational Exuberance -- it makes a strong case that the market was overpriced in 2000, but it doesn't spend much time discussing the fair value of the market. The historical average is about 16 which is again skewed by recent history. I've produced another chart assuming a fair P/E ratio of 15. Years in which the Earnings line ducks under the Price line (such as 2000) would be years when the market is overvalued. Maybe this ratio is fair and maybe it isn't.

A practical question for me, right now, is whether or not the S&P 500 index is overpriced at a P/E of 18. I think it might be.

Footnote:
[1]   I noticed after I made the graph that the original goes to $1600.

sp500_1.jpg


Posted by Hello

sp500_2.jpg


Posted by Hello

sp500_3.jpg


Posted by Hello

sp500_4.jpg


Posted by Hello

Tuesday, October 26, 2004

A coin flip

Imagine that someone offered you a chance to win a million dollars if you can correctly guess the result of a coin flip. The expected payout would be $500,000 and you could probably sell the chance to some wealthy individual for almost that amount. Buying the chance for $450,000, for instance would be a $50,000 expected return. In other words for a small price (relatively speaking, of course), you could trade a situation with an extreme range of outcomes for a certain outcome.

This is an example of a win-win hedge: you get a large sum of money and the other party gets a discounted chance at a large payout. If the buyer can make this sort of transaction over and over, he'll make a good profit with moderate risk. This is how casinos and insurance companies work more or less.

Suppose you decided to keep the chance and sell a chance to win a million dollars on that same coin flip to someone else. You have an expected return of $500,000 on the first transaction and ($500,000) on the second (plus whatever you sold the chance for). But there are two possible way for these transactions to pay out. It all depends on whether or not you make the same guess as the person you sold a chance to. Here's a chart showing the difference:

You  | Same | Not 
-----|------|--------------
Win  |   0  |  $1,000,000
Loss |   0  | ($1,000,000)

In other words, if the guesses are the same, it's no different than selling your chance. But if they are different, the variation of results is huge. You would risk nothing in the first case and everything on the second. Statistically speaking, you would say that the results if the guesses are the different have a correlation of 1 and -1 when they are the same. If the bets were on two coin flips, the correlation in either case would be 0.

Obviously this is an extreme simplification of what investors are faced with. I own Raytheon stock and work for Raytheon, but there's not a huge amount of correlation between my job security and my company's performance. In some ways the election will matter a lot more, since I depend more on the federal budget than on Raytheon itself.

Real life is more like betting on hundreds of coin flips and we don't always know how they are going to interact. Like an insurance company, you have to spread out the risk and buy it at a discount.